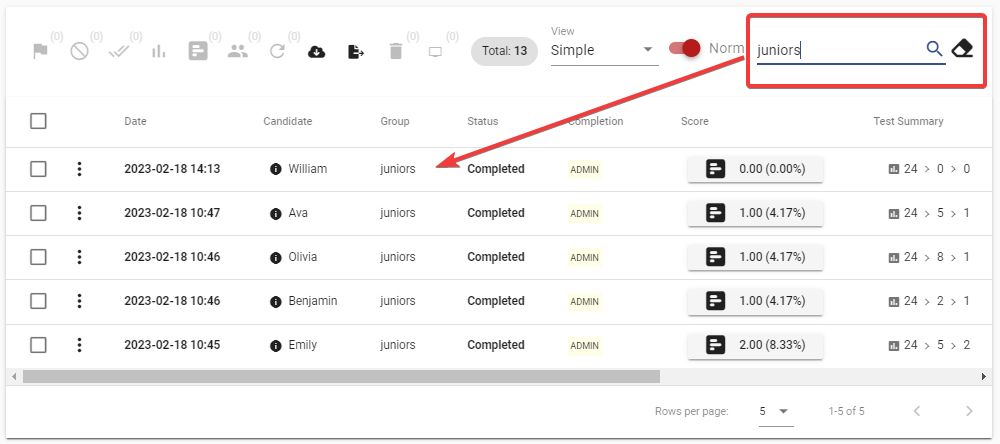
You can use the search panel to filter and retrieve a list of test sessions based on various criteria.
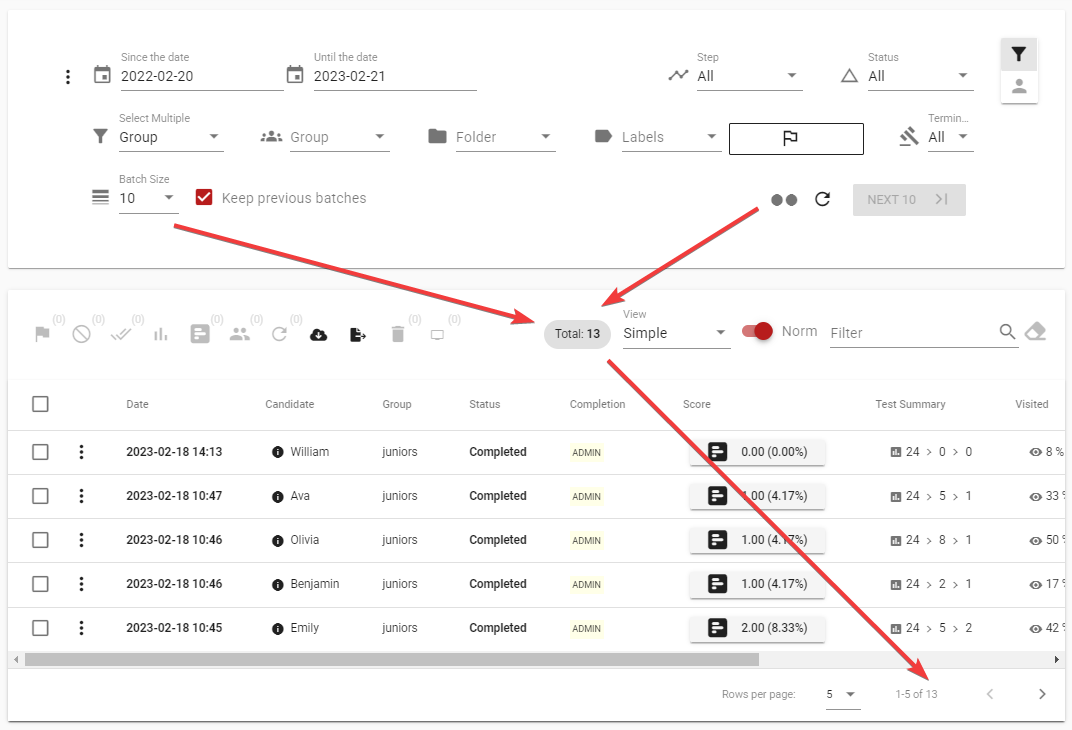
You can enter a search keyword and the table will then search all test sessions for matches with the keyword and filter the results to display only those that match. You can search for test sessions using various attributes, including the candidate's name, test name, group, candidate labels and tags, and other related criteria.
You can access a quick summary report that provides a brief overview of the test report without the need to load the full report.
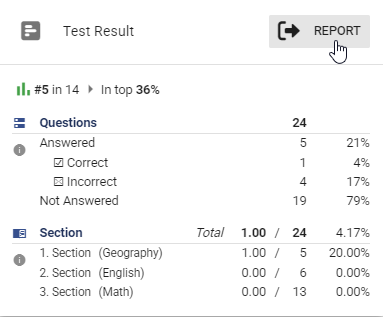
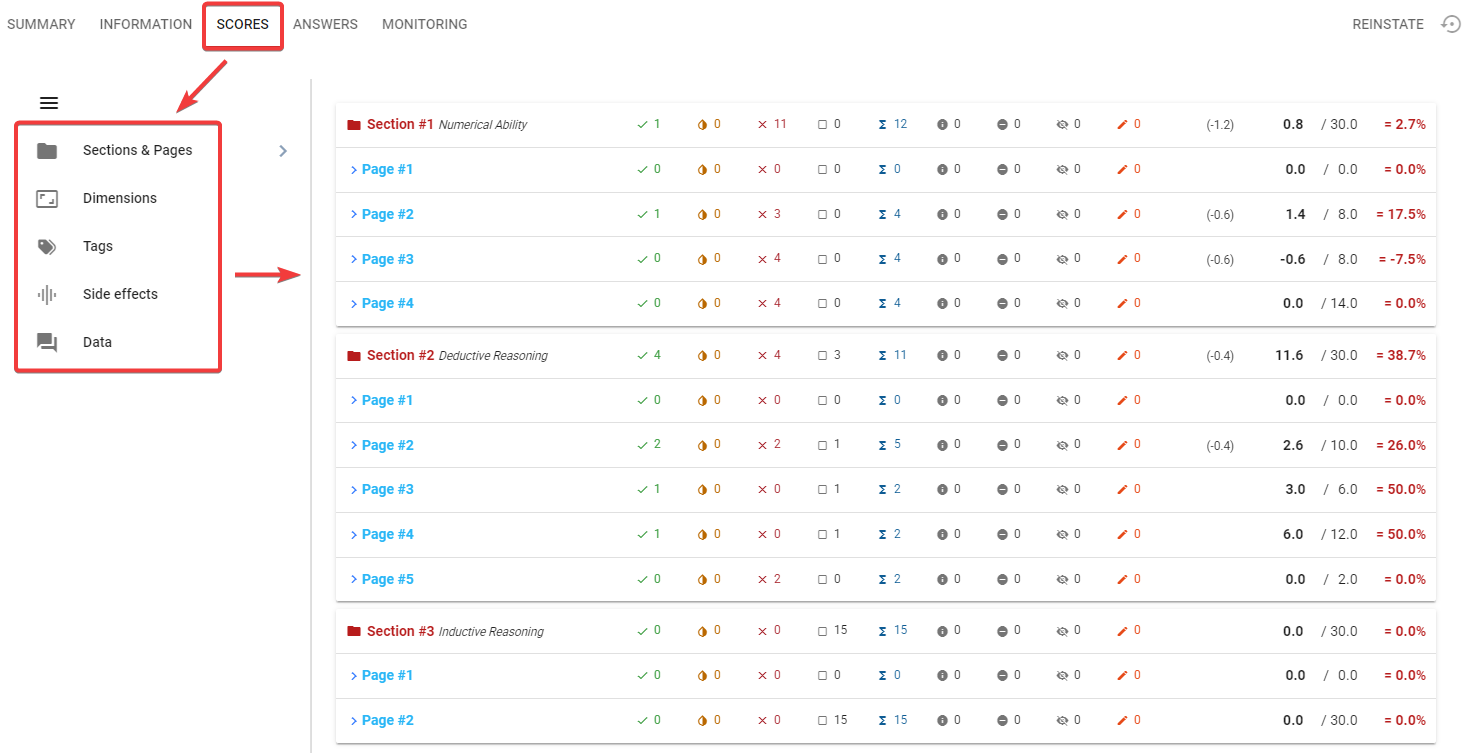
The question scorecard indicates the number of questions that have been answered, the number of correct and incorrect answers, the number of answers that require manual evaluation, and the number of unanswered questions.

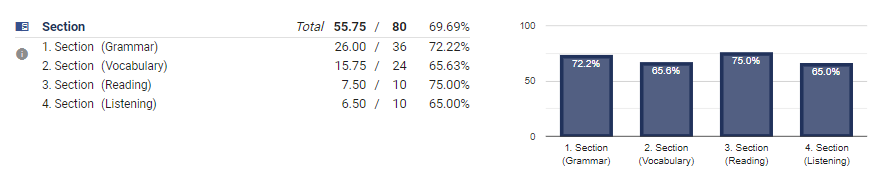
The section scorecard displays a comprehensive list of all the sections, including the user's score, the maximum score attainable, and the percentage based on these values.
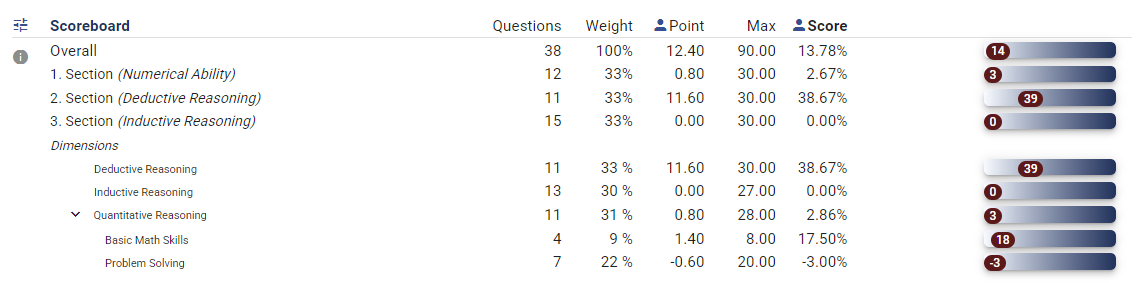
The scoreboard card presents a hierarchical structure of all sections and dimensions in a tree format. Additionally, it includes the number of questions in each section, the maximum attainable points, the weight (which is the ratio of the maximum to the test's grand maximum), the user's score, and the percentage of the user's score in relation to the maximum attainable points.
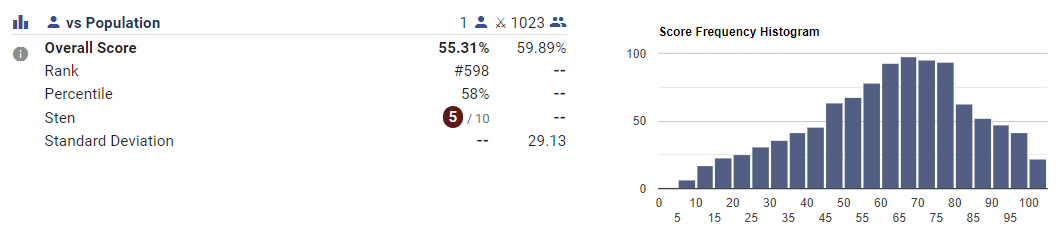
The population card exhibits a brief summary of the population, which the test-taker's score will be evaluated against. Additionally, it shows the sten score, rank, and percentile of the test-taker compared to the population.
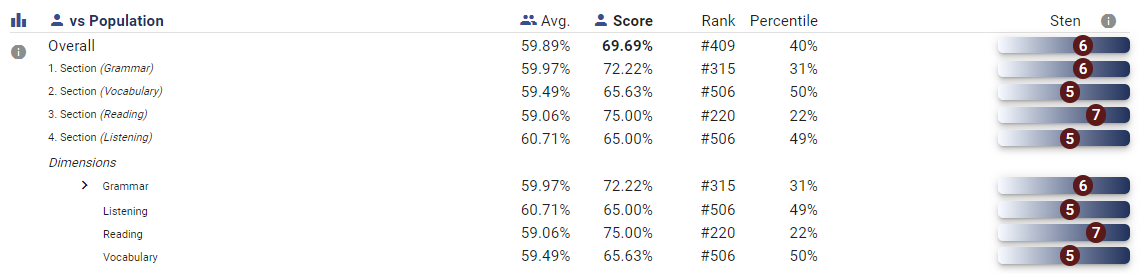
The comparison card contrasts the test-taker's scores against the auto-generated norm or the configured benchmark. It presents the rank, percentile, and sten score of the test-taker within the population for comparison.
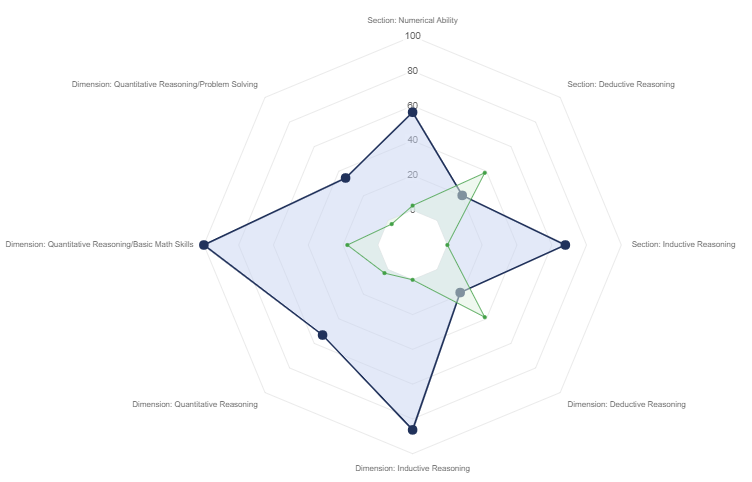
The radar chart provides a visual representation of the test-taker's scores in each section or dimension, along with the norm's position, allowing for a quick comparison to identify areas of strength and weakness.
Testinvite provides various choices to tailor your test's report according to your preferences. You can use your custom HTML and CSS templates, as well as a custom JavaScript function to process test score data.
The scores tab of the test report offers several subcategories where you can access comprehensive scoring details for individual sections, pages, dimensions, side effects, or tags.
In the Test Report, the "Answers" tab displays all the questions from the test session along with their corresponding answers.

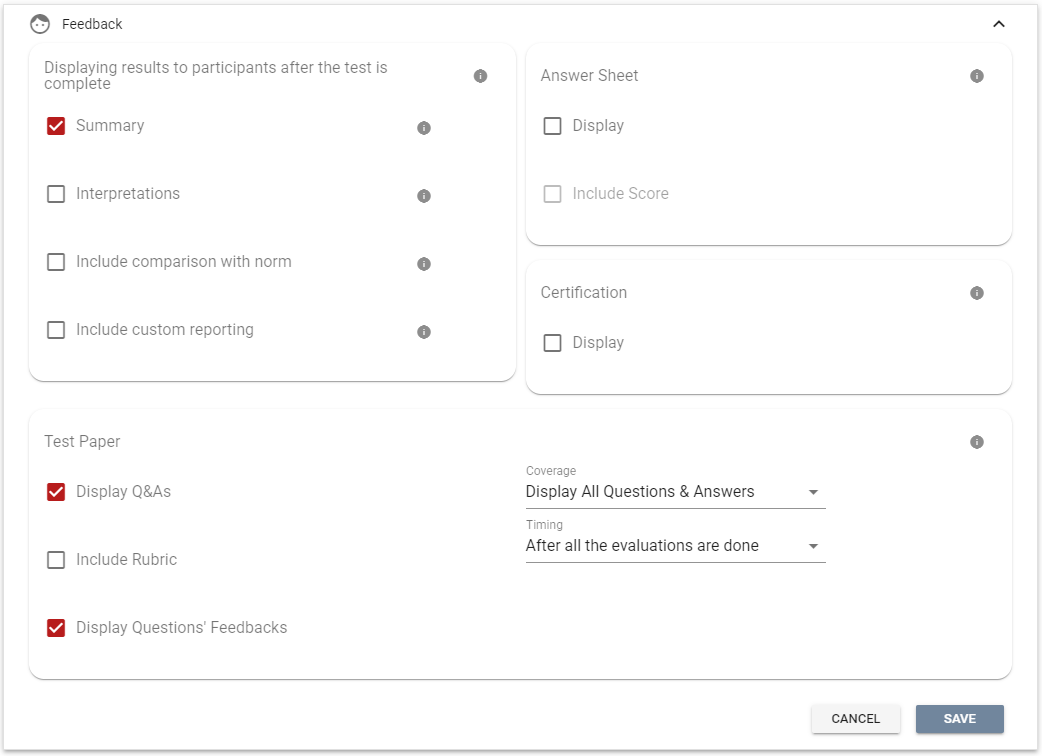
You can grant test-takers access to their test reports based on the level of access you have configured.
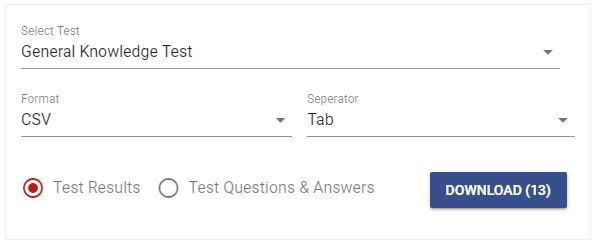
You can export test results, as well as the questions and answers within test sessions, to conduct further analysis on your local computer.

Author
