Test report

The primary elements of the test report

Created by Mustafa Ekim

At the conclusion of each test session, a test report is generated.

To access a test session's report,

  1. Navigate to the Test Sessions panel in the Task Manager
    1. Use the search panel to load the relevant test sessions
      1. Click on the button in the 'Score' column of the test session you wish to access.
        1. Select the Report button from the small dialog box that appears after clicking the button.
          <br>

          The report summary

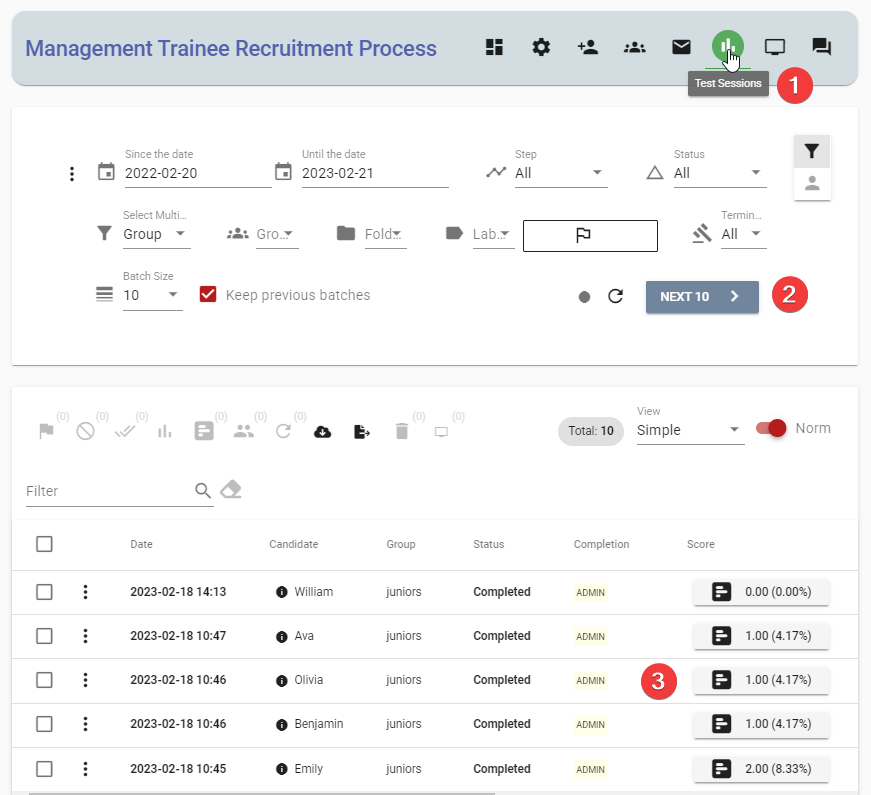
          The report summary has multiple sections.

          The participant card

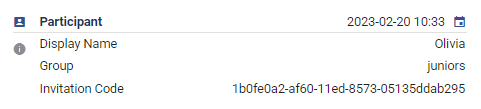
          The participant card displays information about who took the test and when it was taken.

          The overall score card

          The overall scorecard shows the number of points the test-taker achieved, the maximum possible points, and the percentage breakdown of these values.

          The questions scorecard

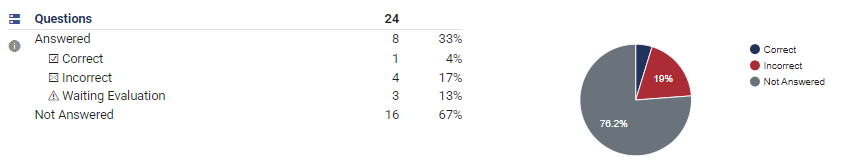
          The question scorecard indicates the number of questions that have been answered, the number of correct and incorrect answers, the number of answers that require manual evaluation, and the number of unanswered questions.

          Section scorecard

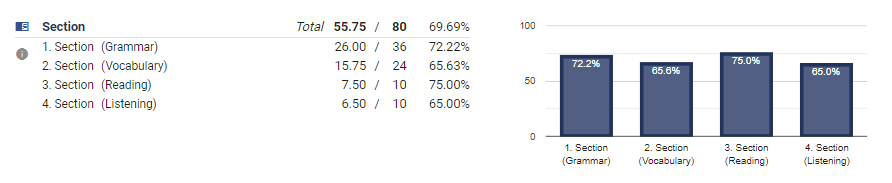
          The section scorecard displays a comprehensive list of all the sections, including the user's score, the maximum score attainable, and the percentage based on these values.

          Scoreboard card

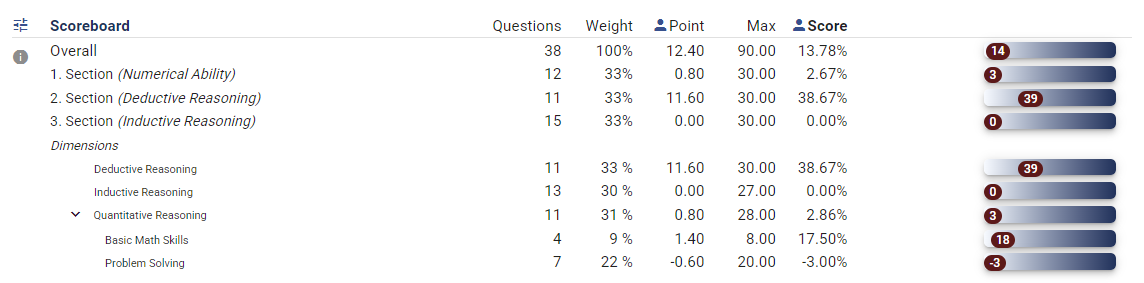
          The scoreboard card presents a hierarchical structure of all sections and dimensions in a tree format. Additionally, it includes the number of questions in each section, the maximum attainable points, the weight (which is the ratio of the maximum to the test's grand maximum), the user's score, and the percentage of the user's score in relation to the maximum attainable points.

          The dimensions are displayed in a hierarchical format, enabling you to navigate through them and identify the test-taker's strengths and weaknesses in different areas.
          The dimensions are displayed in a hierarchical format, enabling you to navigate through them and identify the test-taker's strengths and weaknesses in different areas.

          Population card

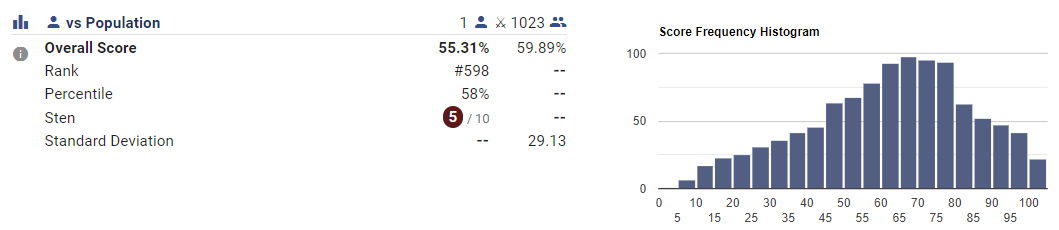
          The population card exhibits a brief summary of the population, which the test-taker's score will be evaluated against. Additionally, it shows the sten score, rank, and percentile of the test-taker compared to the population.

          The histogram shows the number of people who achieved each fragment of the test's overall score. If the histogram graph exhibits a normal distribution, it indicates that the test results are sensible.
          The histogram shows the number of people who achieved each fragment of the test's overall score. If the histogram graph exhibits a normal distribution, it indicates that the test results are sensible.

          Comparison card

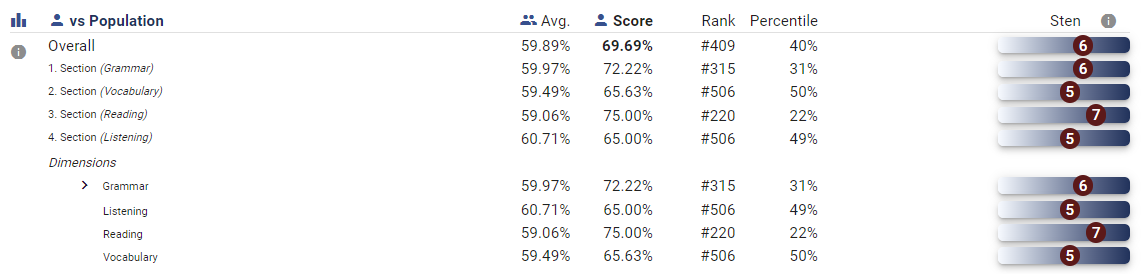
          The comparison card contrasts the test-taker's scores against the auto-generated norm or the configured benchmark. It presents the rank, percentile, and sten score of the test-taker within the population for comparison.

          The radar chart

          The radar chart provides a visual representation of the test-taker's scores in each section or dimension, along with the norm's position, allowing for a quick comparison to identify areas of strength and weakness.
          The radar chart provides a visual representation of the test-taker's scores in each section or dimension, along with the norm's position, allowing for a quick comparison to identify areas of strength and weakness.
          Go Back

          Start designing online assessments with Testinvite today