All Resources


Save over $20,000 with TestInvite, thanks to our low fixed fees and usage-based pricing model, which favors a 'pay only for what you use' approach.
Protect yourself from installation issues, version incompatibilities, and consumer rights violations with 100% web-compatible software.
Not all organizations prioritize reliable and accurate assessments for informed decision-making, but our customers do. TestInvite is trusted by reputable organizations in over 90 countries who understand the importance of a secured and data-driven approach to making smart decisions.
Revolutionize your professional associations with TestInvite's advanced assessment platform. By seamlessly integrating high-quality assessments, you can certify members' knowledge and skills with unparalleled precision. Validate the effectiveness of training sessions and workshops, and harness assessments to upskill professionals and maintain industry standards. With TestInvite, you empower your association to cultivate a community of highly skilled individuals while demonstrating the tangible value of your initiatives through comprehensive analytics and reporting. Elevate your association's stature and foster a culture of continuous learning and professional excellence with TestInvite.
Transform your hiring process with TestInvite's versatile assessment platform. Craft custom assessments tailored to your organization's unique needs, whether it's evaluating technical expertise, soft skills, or cultural fit. Supplement these with our extensive library of ready-to-use hiring tests designed to identify the best candidates based on their knowledge, skills, personality traits, and more. With TestInvite, you gain the flexibility to create assessments that precisely align with your hiring criteria, ensuring that only the most qualified candidates advance through the selection process. Streamline your recruitment efforts, make informed hiring decisions, and build a team of top talent with TestInvite's comprehensive suite of assessment tools.
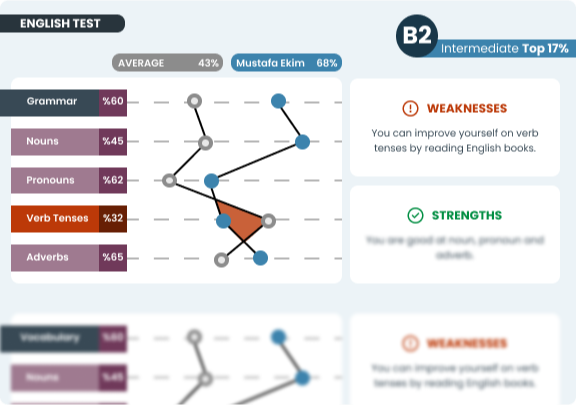
Transform your organization's learning and development efforts with TestInvite's robust assessment platform. Evaluate the effectiveness of your initiatives by validating learning outcomes, measuring progress across various subjects, and pinpointing both strengths and weaknesses within your workforce. With customizable assessments tailored to your specific objectives, TestInvite enables you to drive targeted interventions and personalized learning experiences for each employee. Gain valuable insights into competencies and proficiency levels, and empower your workforce to thrive in a culture of continuous learning and growth.
Revolutionize vocational training centers with TestInvite's specialized assessment platform. Build a comprehensive question bank spanning various subjects pertinent to specific job roles, enabling the creation of tailored assessments that assess competencies crucial for success in those roles. These assessments serve as invaluable tools for pinpointing areas requiring improvement, offering targeted practice opportunities, and ensuring candidates are well-prepared to excel in their chosen vocations. With TestInvite, vocational training centers can enhance their training programs, equip candidates with job-specific skills, and ultimately drive success in the workforce.
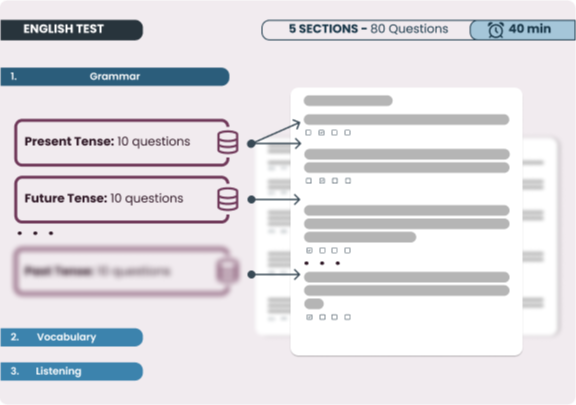
Elevate your certification programs with TestInvite's advanced assessment features. Utilize our smart randomization test engine to design certification assessments that prevent predictability in content, ensuring fairness and integrity while evaluating candidates across multiple dimensions. With TestInvite, you can create dynamic assessments that yield reliable and insightful results, enabling you to certify individuals with confidence and precision. Whether you're assessing technical proficiency, adherence to industry standards, or mastery of specialized skills, our platform empowers you to maintain the highest standards of certification while providing candidates with a fair and rigorous evaluation process.
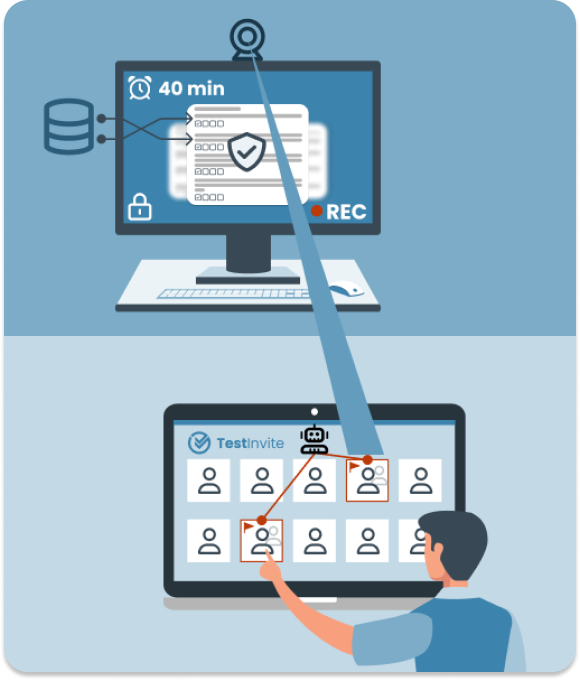
Transform your admission process with TestInvite's cutting-edge assessment platform. Seamlessly conduct online admission tests or competitive assessments for thousands of participants simultaneously, ensuring a smooth and efficient experience for both administrators and candidates alike. With built-in proctoring features, TestInvite safeguards the integrity of every assessment, guaranteeing fair and reliable results. Whether you're admitting students to educational institutions or selecting candidates for competitive programs, our platform empowers you to maintain the highest standards of assessment while accommodating large-scale testing needs. Say goodbye to logistical headaches and hello to a streamlined admission process with TestInvite.
Empower test prep centers with TestInvite's versatile assessment platform. Create customized mock tests tailored to specific examinations, providing individuals with invaluable practice opportunities while pinpointing areas for improvement. Our platform enables seamless test generation, allowing students to simulate real exam conditions and hone their skills in a controlled environment. With detailed performance analytics, individuals can track their progress and focus their efforts on areas needing further attention. Whether preparing for standardized tests, professional certifications, or academic assessments, TestInvite equips test prep centers with the tools to maximize students' success and confidence on exam day.
In the dynamic landscape of modern workforce development, organizations recognize the strategic importance of acquiring young talent. Crafting tailored assessment workflows for hiring interns and recent graduates is paramount to identifying and nurturing promising individuals who can contribute to the company's growth and innovation. Unlike traditional hiring processes, recruiting interns and graduates demands a specialized approach that accounts for their unique skills, aspirations, and potential. By leveraging customized assessment workflows, companies can effectively evaluate candidates' aptitude, capabilities, and cultural fit, ensuring a seamless transition into the organization. TestInvite provides the perfect platform to design and implement these workflows, offering flexibility, scalability, and advanced features to streamline the recruitment process while maintaining the highest standards of fairness and integrity. With TestInvite, organizations can confidently attract, assess, and onboard the next generation of talent, positioning themselves for sustained success in the ever-evolving marketplace.
In the realm of competitive exams, precision and integrity are paramount. Crafting tailored assessment workflows for competition exams is essential to ensuring fair evaluation and identifying top performers. Unlike standard assessments, competition exams often entail a rigorous selection process with a large pool of candidates vying for limited positions or prestigious opportunities. This demands a specialized approach that accounts for the unique challenges of such exams, including preventing cheating and maintaining the integrity of the assessment process. With TestInvite's advanced platform, organizations can develop customized workflows that address these challenges head-on, leveraging features such as proctoring, secure test delivery, and smart randomization to ensure a level playing field for all participants. By harnessing TestInvite's robust capabilities, competition organizers can uphold the highest standards of fairness and accuracy, ultimately identifying the most deserving candidates and fostering a culture of excellence in competitive environments.


